

A significant portion of the prospective student journey takes place on your school’s website. From user experience to page load speed, there are several factors that need to be measured and analyzed frequently to assess the overall performance of your website.
Are visits growing month over month? Can prospective students easily find the information they’re looking for? Where are the friction points? What pages and content are resulting in the most conversions?
 Pro Tip: Improve your school’s website visit-to-lead conversion rate with these pointers.
Analytics platforms, if used correctly, can answer those questions and provide insights in order to make smarter decisions. And while using multiple analytics tools can provide better insights, most of us only have the time and budget for one tool.
Let’s look at HubSpot and Google Analytics, two of the best website traffic analytics platforms available to enrollment marketers, and learn why using both can help complete the entire picture of your school’s website performance.
What to Expect From HubSpot's Analytics
HubSpot prides itself on “closed-loop” data and reporting. “Closing the loop” is marked by the ability to connect marketing analytics with customer relationship management (CRM) software to align the data collected by the marketing team with the data collected by the sales team. By combining data on leads from the first touchpoint to the point of sale and beyond, HubSpot allows marketers to make better decisions that directly impact the business pipeline.
HubSpot is not a free platform, but its abilities and features tower over Google Analytics. Whereas Google Analytics is a solely analytics platform, HubSpot is a CRM, CMS, automation, email, marketing & sales, and data analytics tool, all bundled into one. But, we’ll stick to its analytics tool capabilities for now.
HubSpot does collect information on your website like page views, sessions, time on page, exit/entrance rates, and bounce rates, but perhaps it’s greatest ability is that it measures marketing activities related to promoting your website through content and other inbound marketing tactics. It can achieve this thanks to its connection to the free HubSpot CRM tool, where engagement data from website visitors can be linked directly to a contact’s profile in the CRM.
A Crash Course on Google Analytics
Google Analytics (GA) is a free website analytics tool that collects information about your website’s performance. It can help you answer questions like:
- How many visitors do I attract to my website?
- Where are my page visitors coming from?
- What are the most popular pages on my website?
Marketers find the greatest value from Google Analytics comes from the ability to learn about their website visitors and locate areas of their website that could benefit from improvement. Unlike HubSpot, with Google Analytics you can view visitor behavior differences between those on mobile devices and those on desktop devices. In addition, Google Analytics features a behavior flow tool, providing marketers with insight into how visitors entered your website, where they left your site, and the most common paths visitors take while on your site. This is especially helpful when looking for places of drop-off and high bounce rates on your website.
Other features that Google Analytics has (and that aren’t currently available on HubSpot) include site performance metrics like page load speed, real-time website performance, visitor demographics, and website performance by geographic markets/regions.
Comparison: Traffic Analytics & Sessions
When it comes to analyzing the traffic to your school's website, both HubSpot and Google Analytics are using tracking pixels to collect information on how prospective students are arriving and behaving on your domain. Here’s how the two platforms compare in this category:
How does HubSpot capture and visualize traffic to your school's site?
HubSpot allows you to analyze traffic to your website month over month, year over year, and compare custom date ranges. You can view web sessions from various sources (we’ll get to that in the next section) in addition to other metrics like session length, page views per session, bounce rate, etc.
Here is what an example web traffic analytics report looks like in HubSpot:
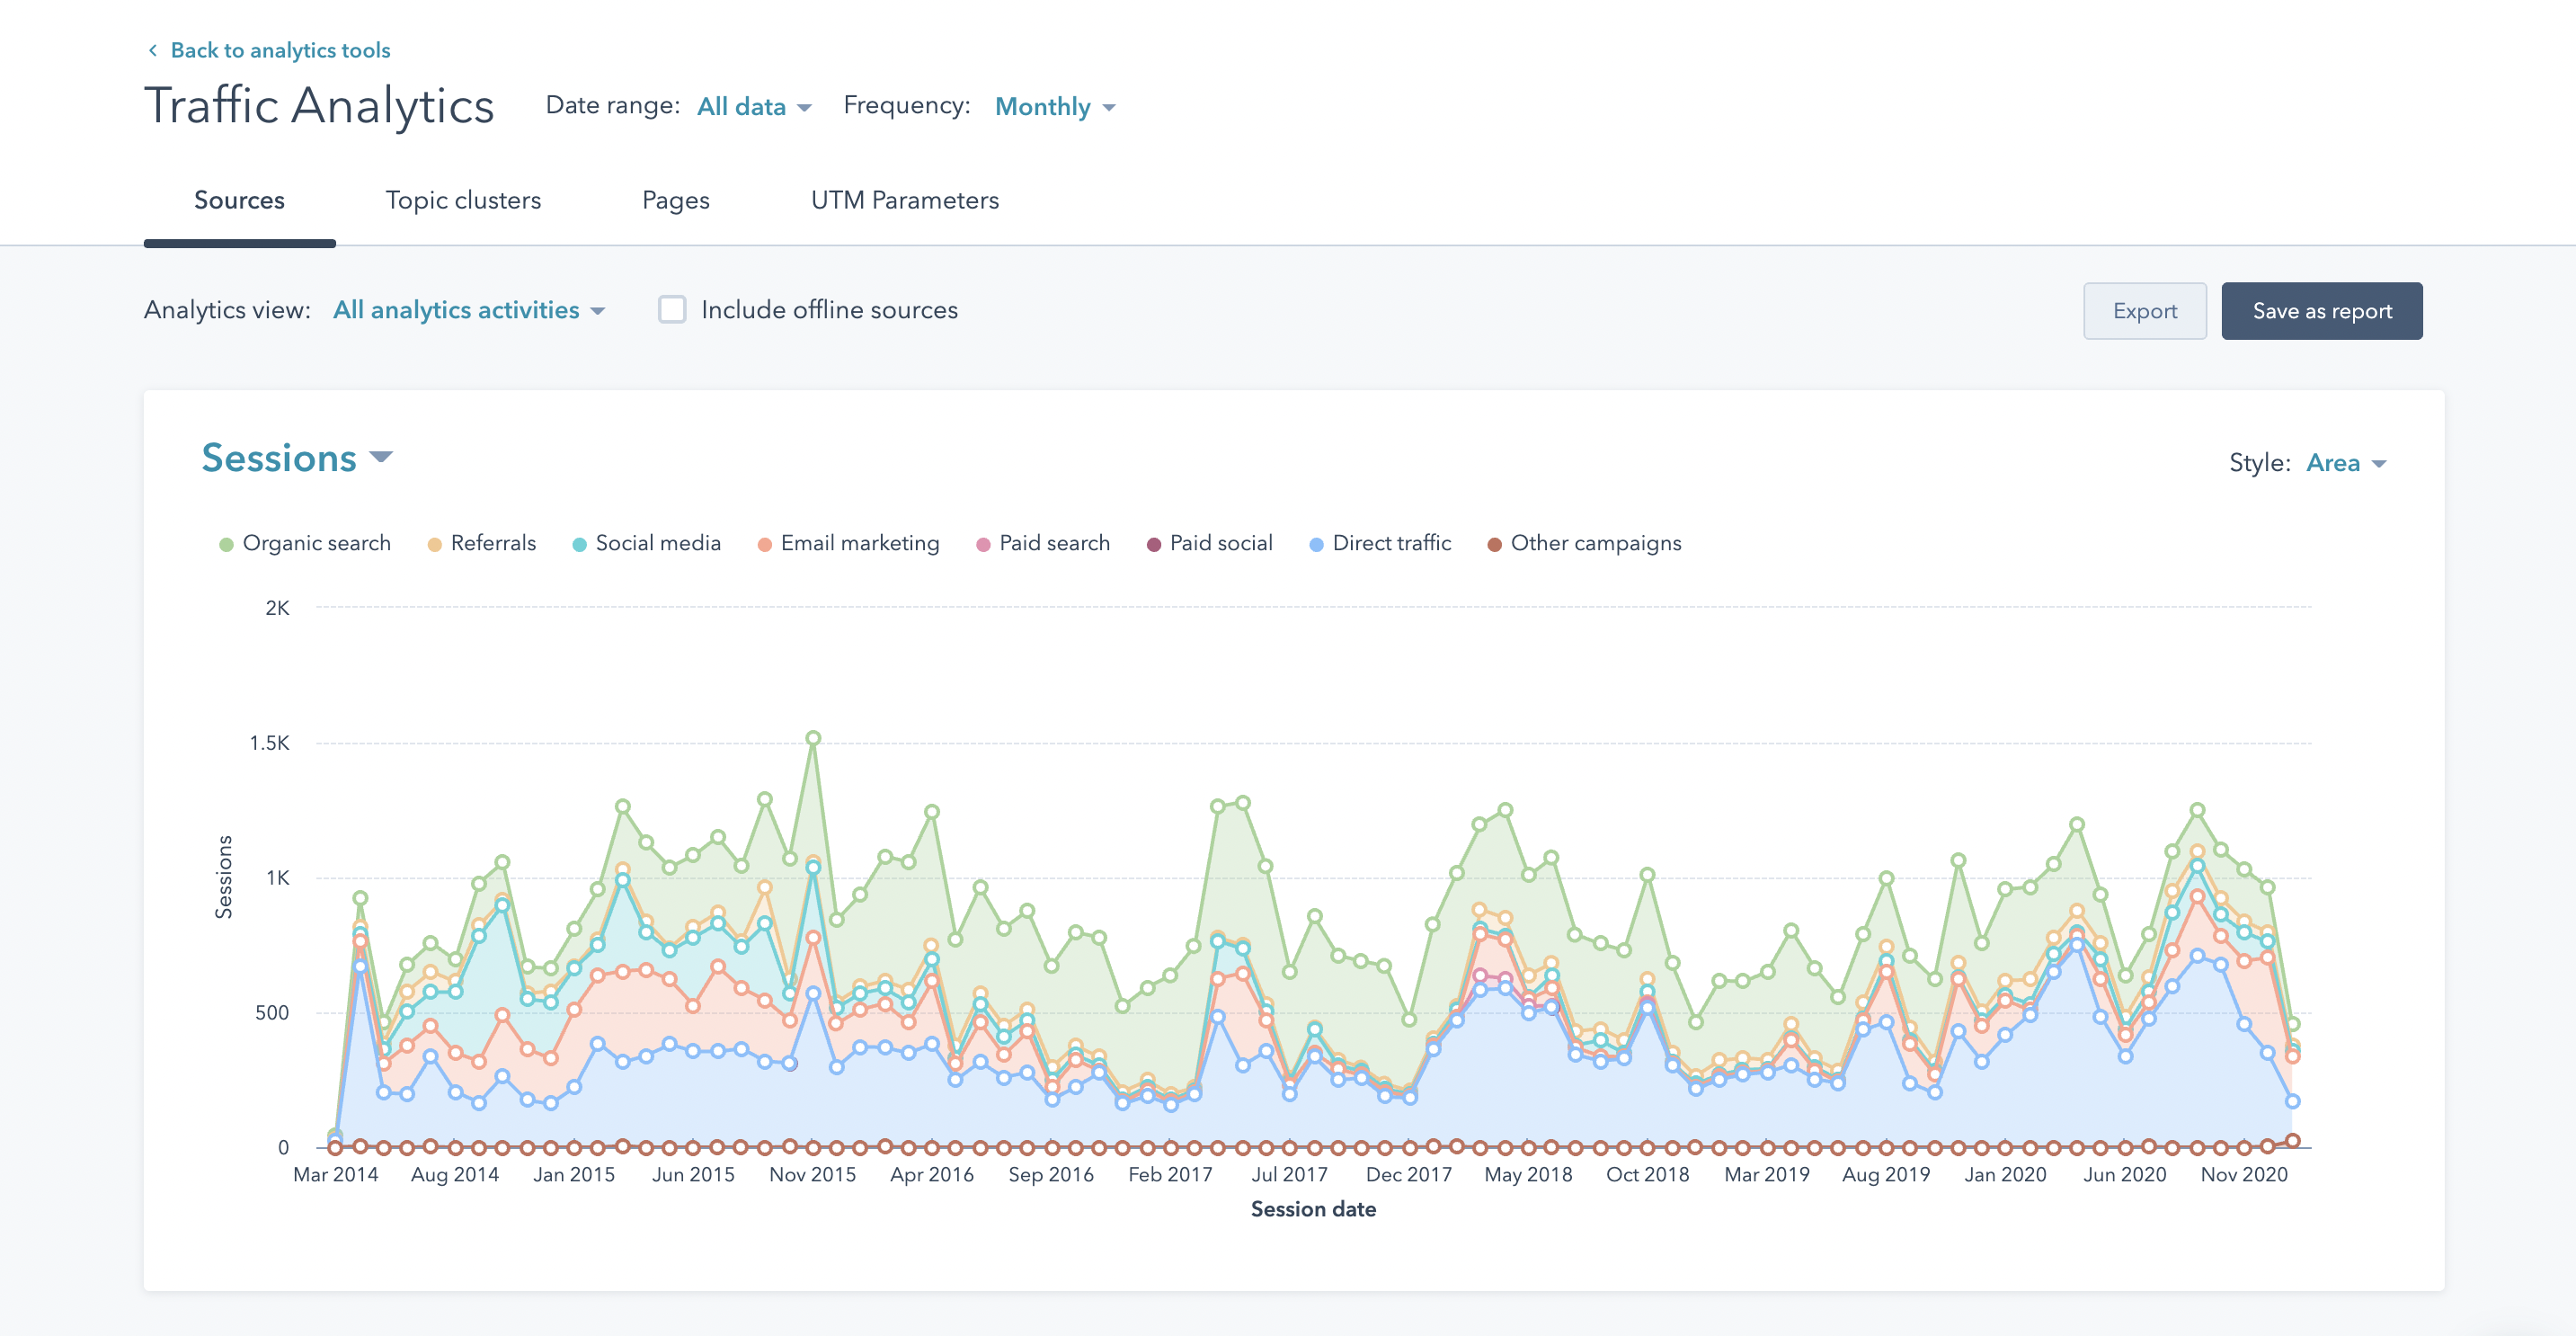 Note: HubSpot measures a session based on the referral domain (google.com, facebook.com) that brought visitors to your website.
How does Google Analytics break down your school's site traffic?
Google Analytics allows you to filter traffic data by date ranges just like HubSpot, but also has features that HubSpot lacks. For example, you can view the devices that visitors are using when they visit your website as well as differentiate new vs returning website visitors.
On top of that, the “Real Time” report provides information on the number of active visitors on your website in real time, including the geographic location they are visiting from, the website page they are actively viewing, and the sources those active visitors came from.
Another report, “When do your users visit?”, allows you to see at what times during the day your website gets the most visits. None of these are capabilities of HubSpot’s traffic analytics report at the current moment.
Here is an example traffic analytics report in Google Analytics:
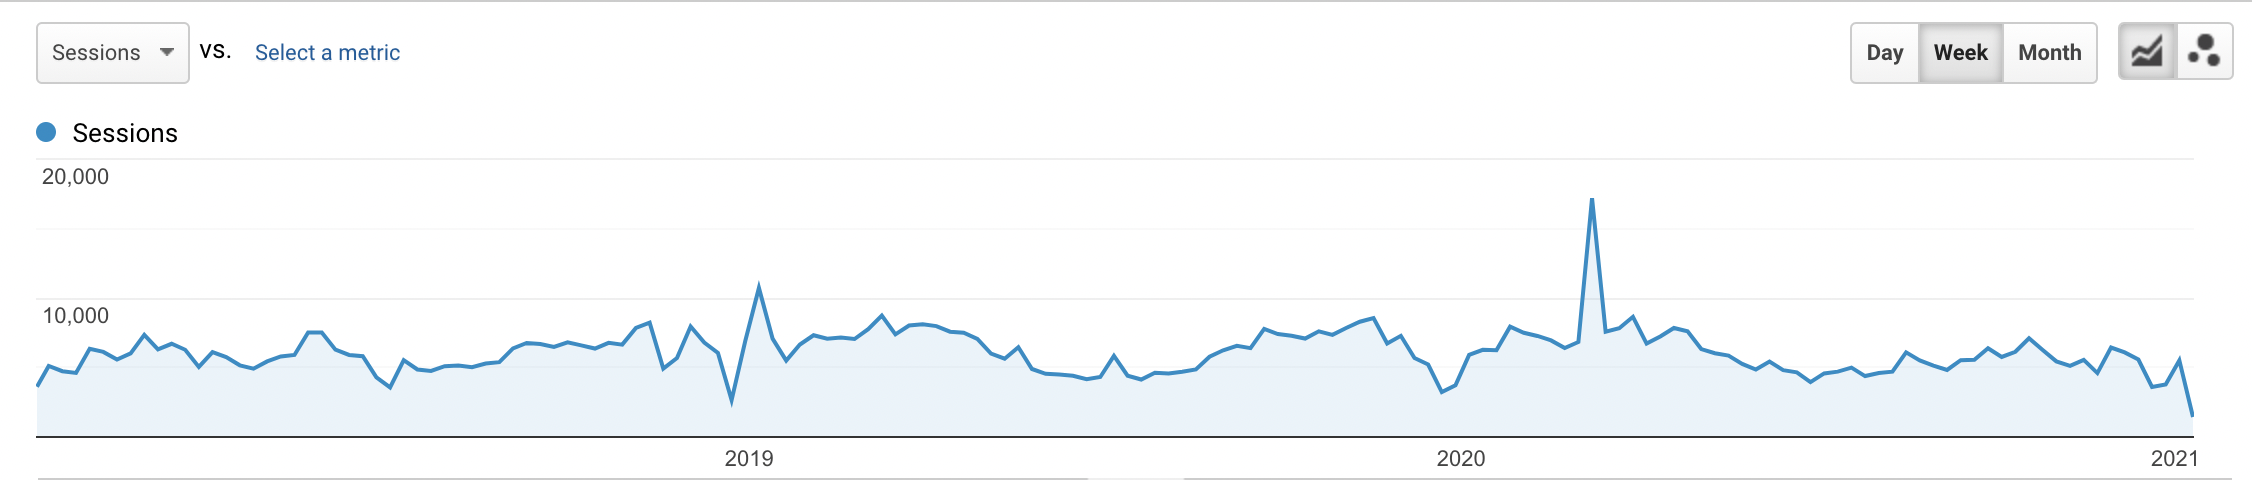 Note: Google Analytics measures a session based on the referral source or medium (Google / Organic, Direct / None, Facebook / Referral) that brings the visitor to the website.
Comparison: Sources Reporting
A sources report shows the breakdown of website visits by different “sources”, or places of origin where a visitor found your website. Here’s how the two compare:
Slice and Dice Which Sources You're Interested in With HubSpot
HubSpot offers traffic analytics in the form of sessions broken down by the following sources:
|
|
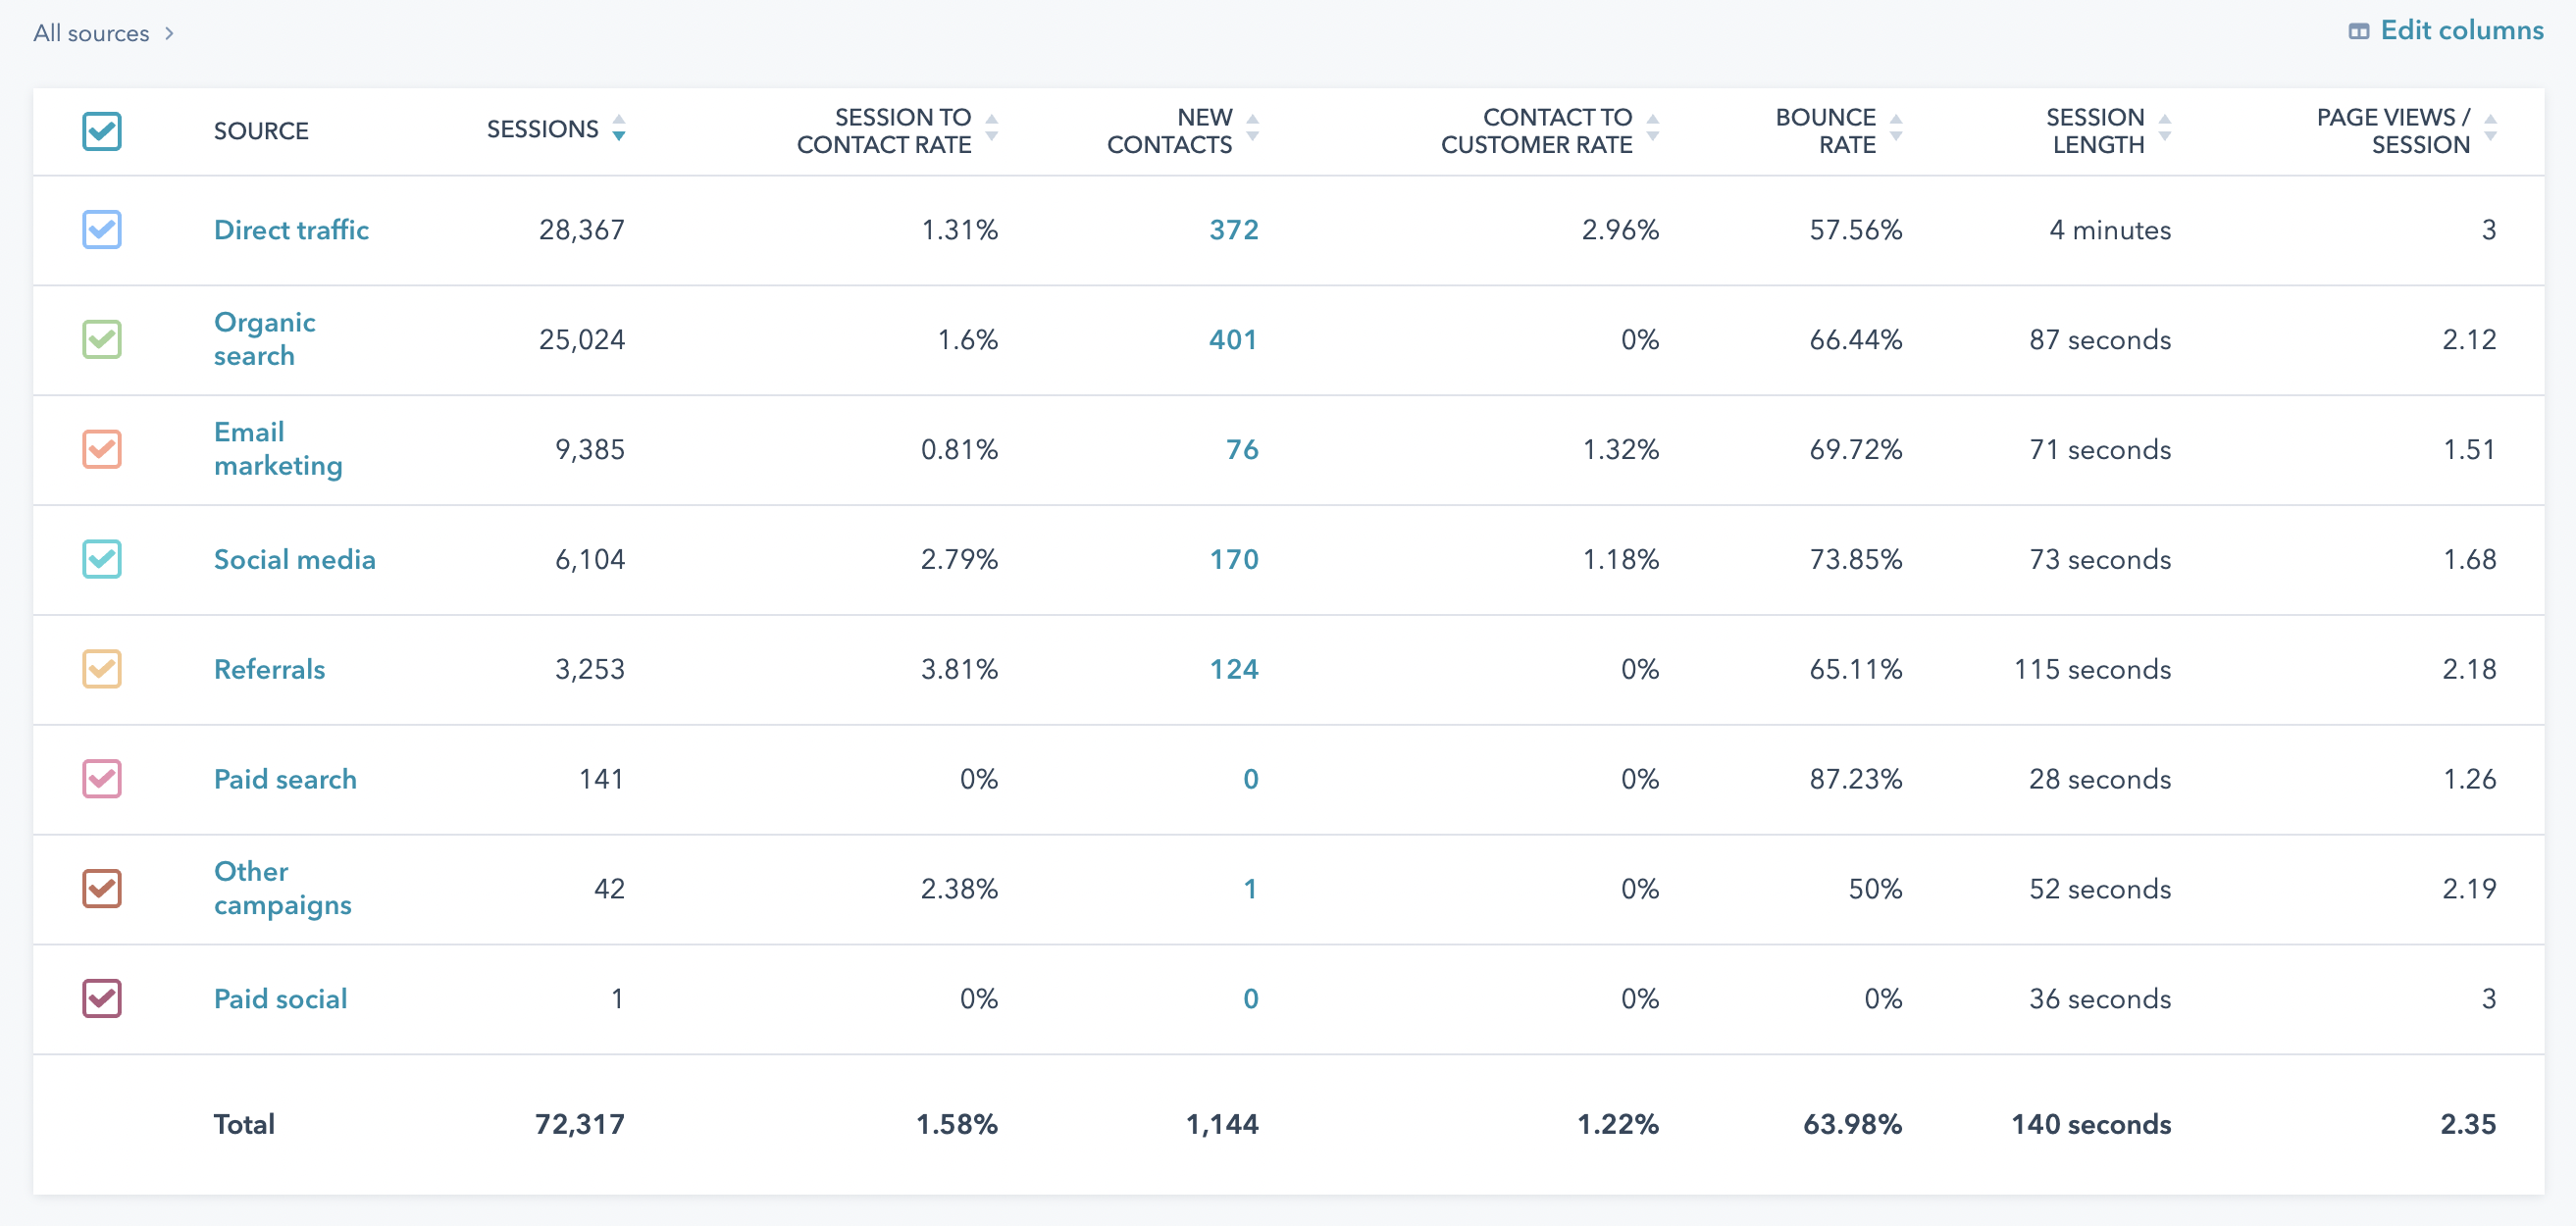
Each source can be further drilled down into. For example, by looking at website sessions sourced by Paid Social (social media advertising), you could drill deeper:
Paid Social > Facebook > [Name of Facebook Ad Campaign]
This would allow you to view all website sessions, new contacts, conversion rates, session lengths, and more attributed to a specific Facebook Ad campaign. For more on marketing attribution, read “The Enrollment Manager’s Guide to Attribution Reporting: Giving Credit Where Credit is Due”.
And remember, since HubSpot is a tool integrated with a CRM, Social Media, and Advertising tools, it will automatically stick UTM tracking parameters to the ends of URLs associated with various activities for you, removing the need to create tracking URLs in most cases. For example, if you were to create and deploy an organic social media post within the HubSpot platform for a particular marketing campaign, HubSpot would automatically add the appropriate tracking parameters so that any website traffic attributable to the social media post would in turn be recorded under the “Social Media” source and correct marketing campaign name.
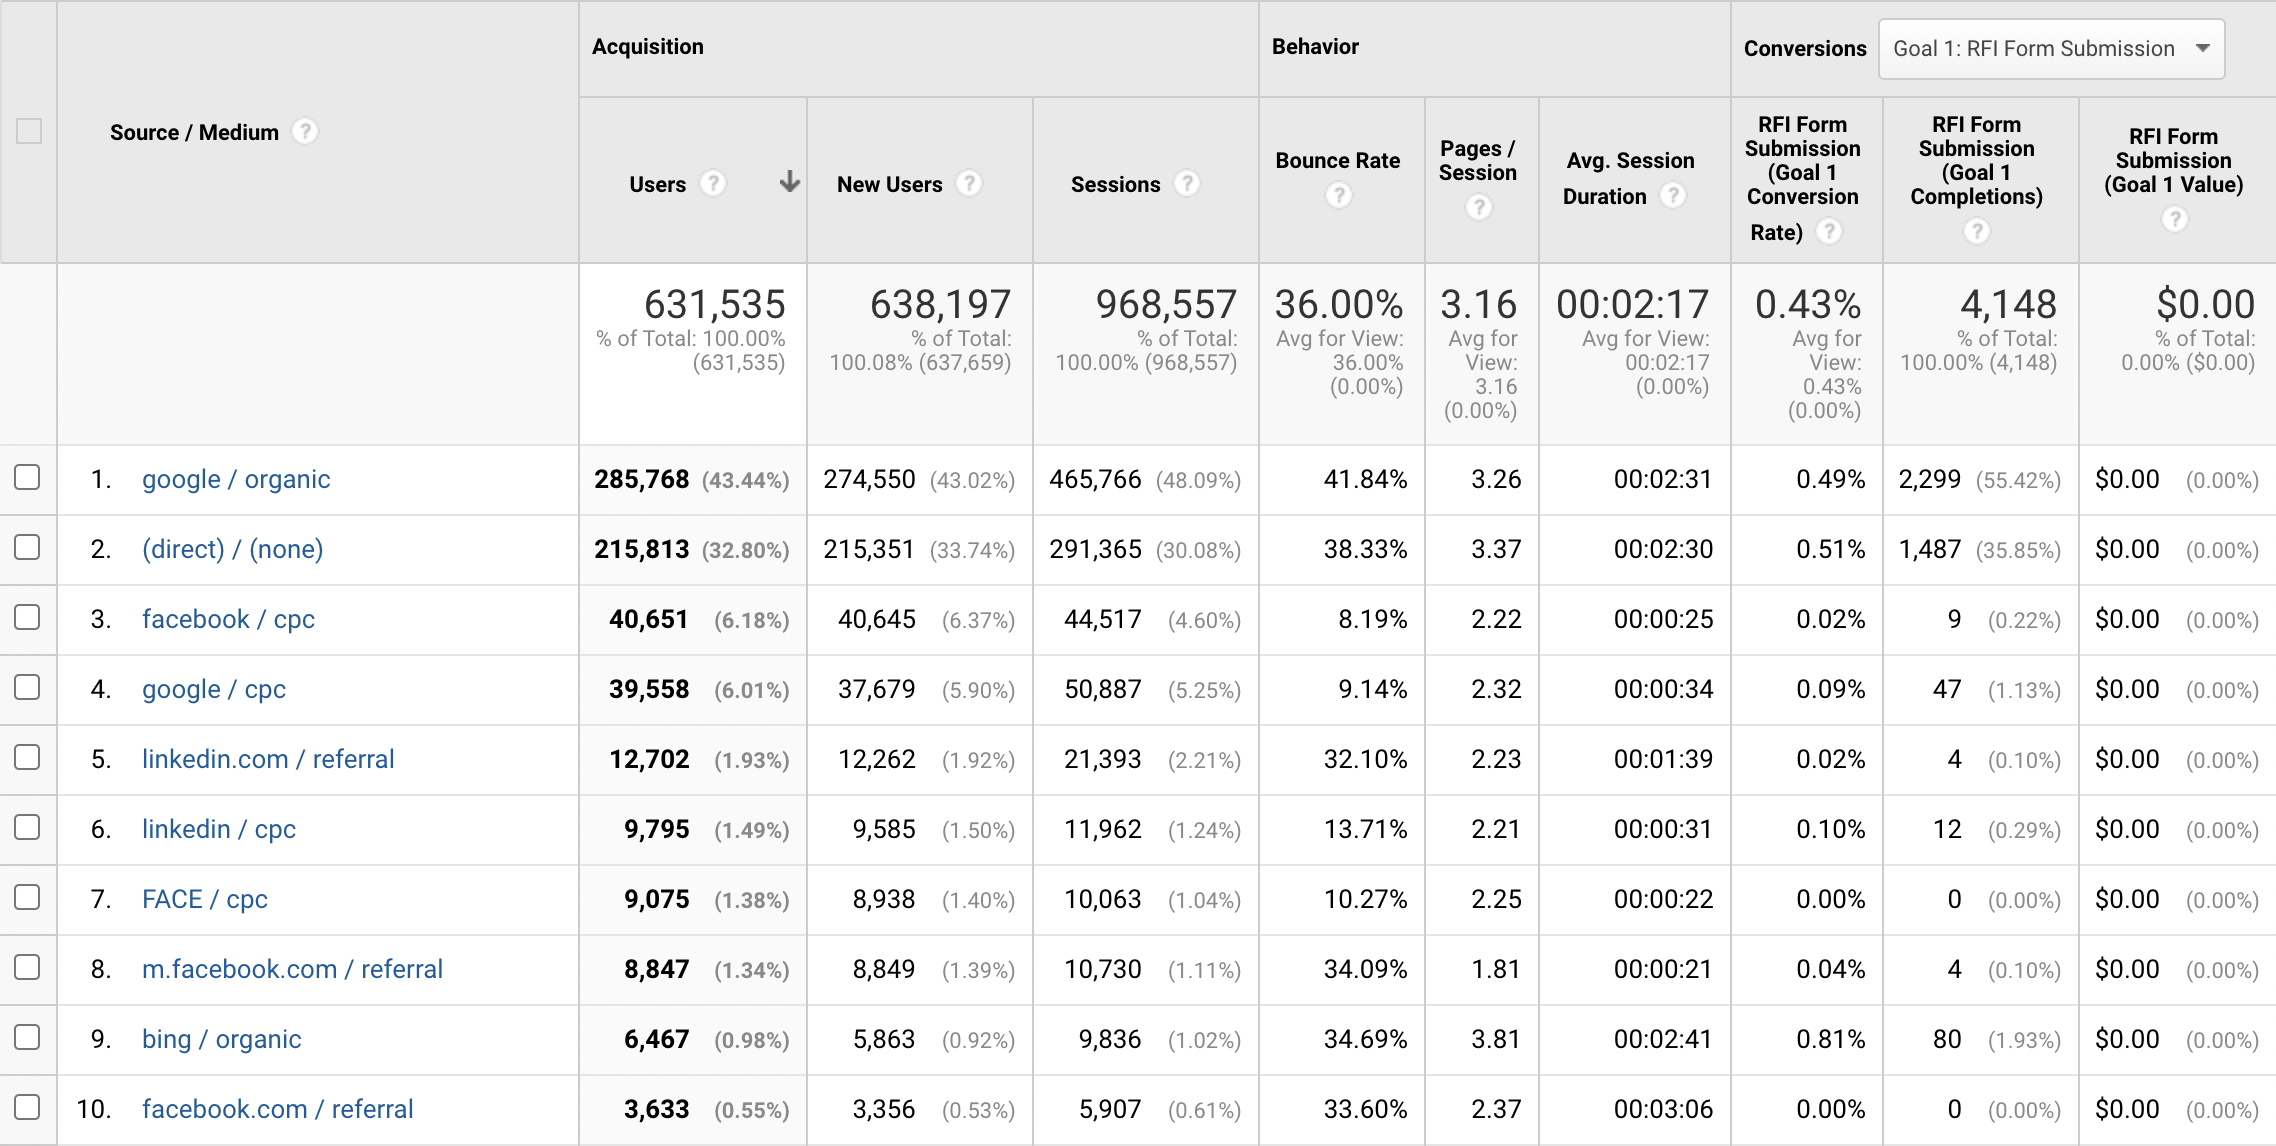
Dive Deep into Session Data with Google Analytics
Google Analytics breaks down website traffic from the following sources:
|
|
Other custom segments can be set up to track sessions from referring sources by using custom UTM parameters.
In addition to traffic sources, Google Analytics displays “mediums”, or the category associated with a source. For example, “Google / Organic” would indicate that your website was visited organically, for example via the Google search engine. “Google / CPC” on the other hand would indicate that your site was visited via Google, but from a CPC advertising campaign.
Comparison: Page Views
Page views show the aggregate number of website pages viewed by visitors over a specified period of time.
HubSpot Links Page Views with Other User Activity at the Individual Level
HubSpot shows page views for blog posts, landing pages, website pages, and any page that has the HubSpot Tracking Pixel embedded on it (including non-HubSpot hosted pages). All HubSpot-hosted pages (all pages created in HubSpot) automatically have the HubSpot Tracking Pixel placed on them.
Because HubSpot also has CRM functionality whereas Google Analytics doesn’t, you not only get page views for each page, you also get the number of form submissions, new contacts, CTA clicks, and other conversion metrics (like Page View to New Contact rate).
Google Analytics Groups Page View Data for Overall Audience Behavior
Like HubSpot, Google Analytics shows page views, bounce rates, entrance and exit rates for all pages with the Google Analytics tracking code installed. Unlike HubSpot, it also shows unique page views: the number of sessions where the specified page was viewed at least once by any user.
Comparison: Conversion Rate
HubSpot is Built for Nurturing Your Students Down the Funnel
In HubSpot, you can easily see which pages and session sources are converting visitors, including a breakdown of those conversions by visitors who are new contacts and those who are returning converters. Better yet, you can actually put names to those conversions because of the integrated CRM functionality. HubSpot also tracks CTA clicks automatically and features integrations with Wistia and Vidyard to track video play-throughs.
Google Analytics Requires Extra Setup to Tie Actions to Goals
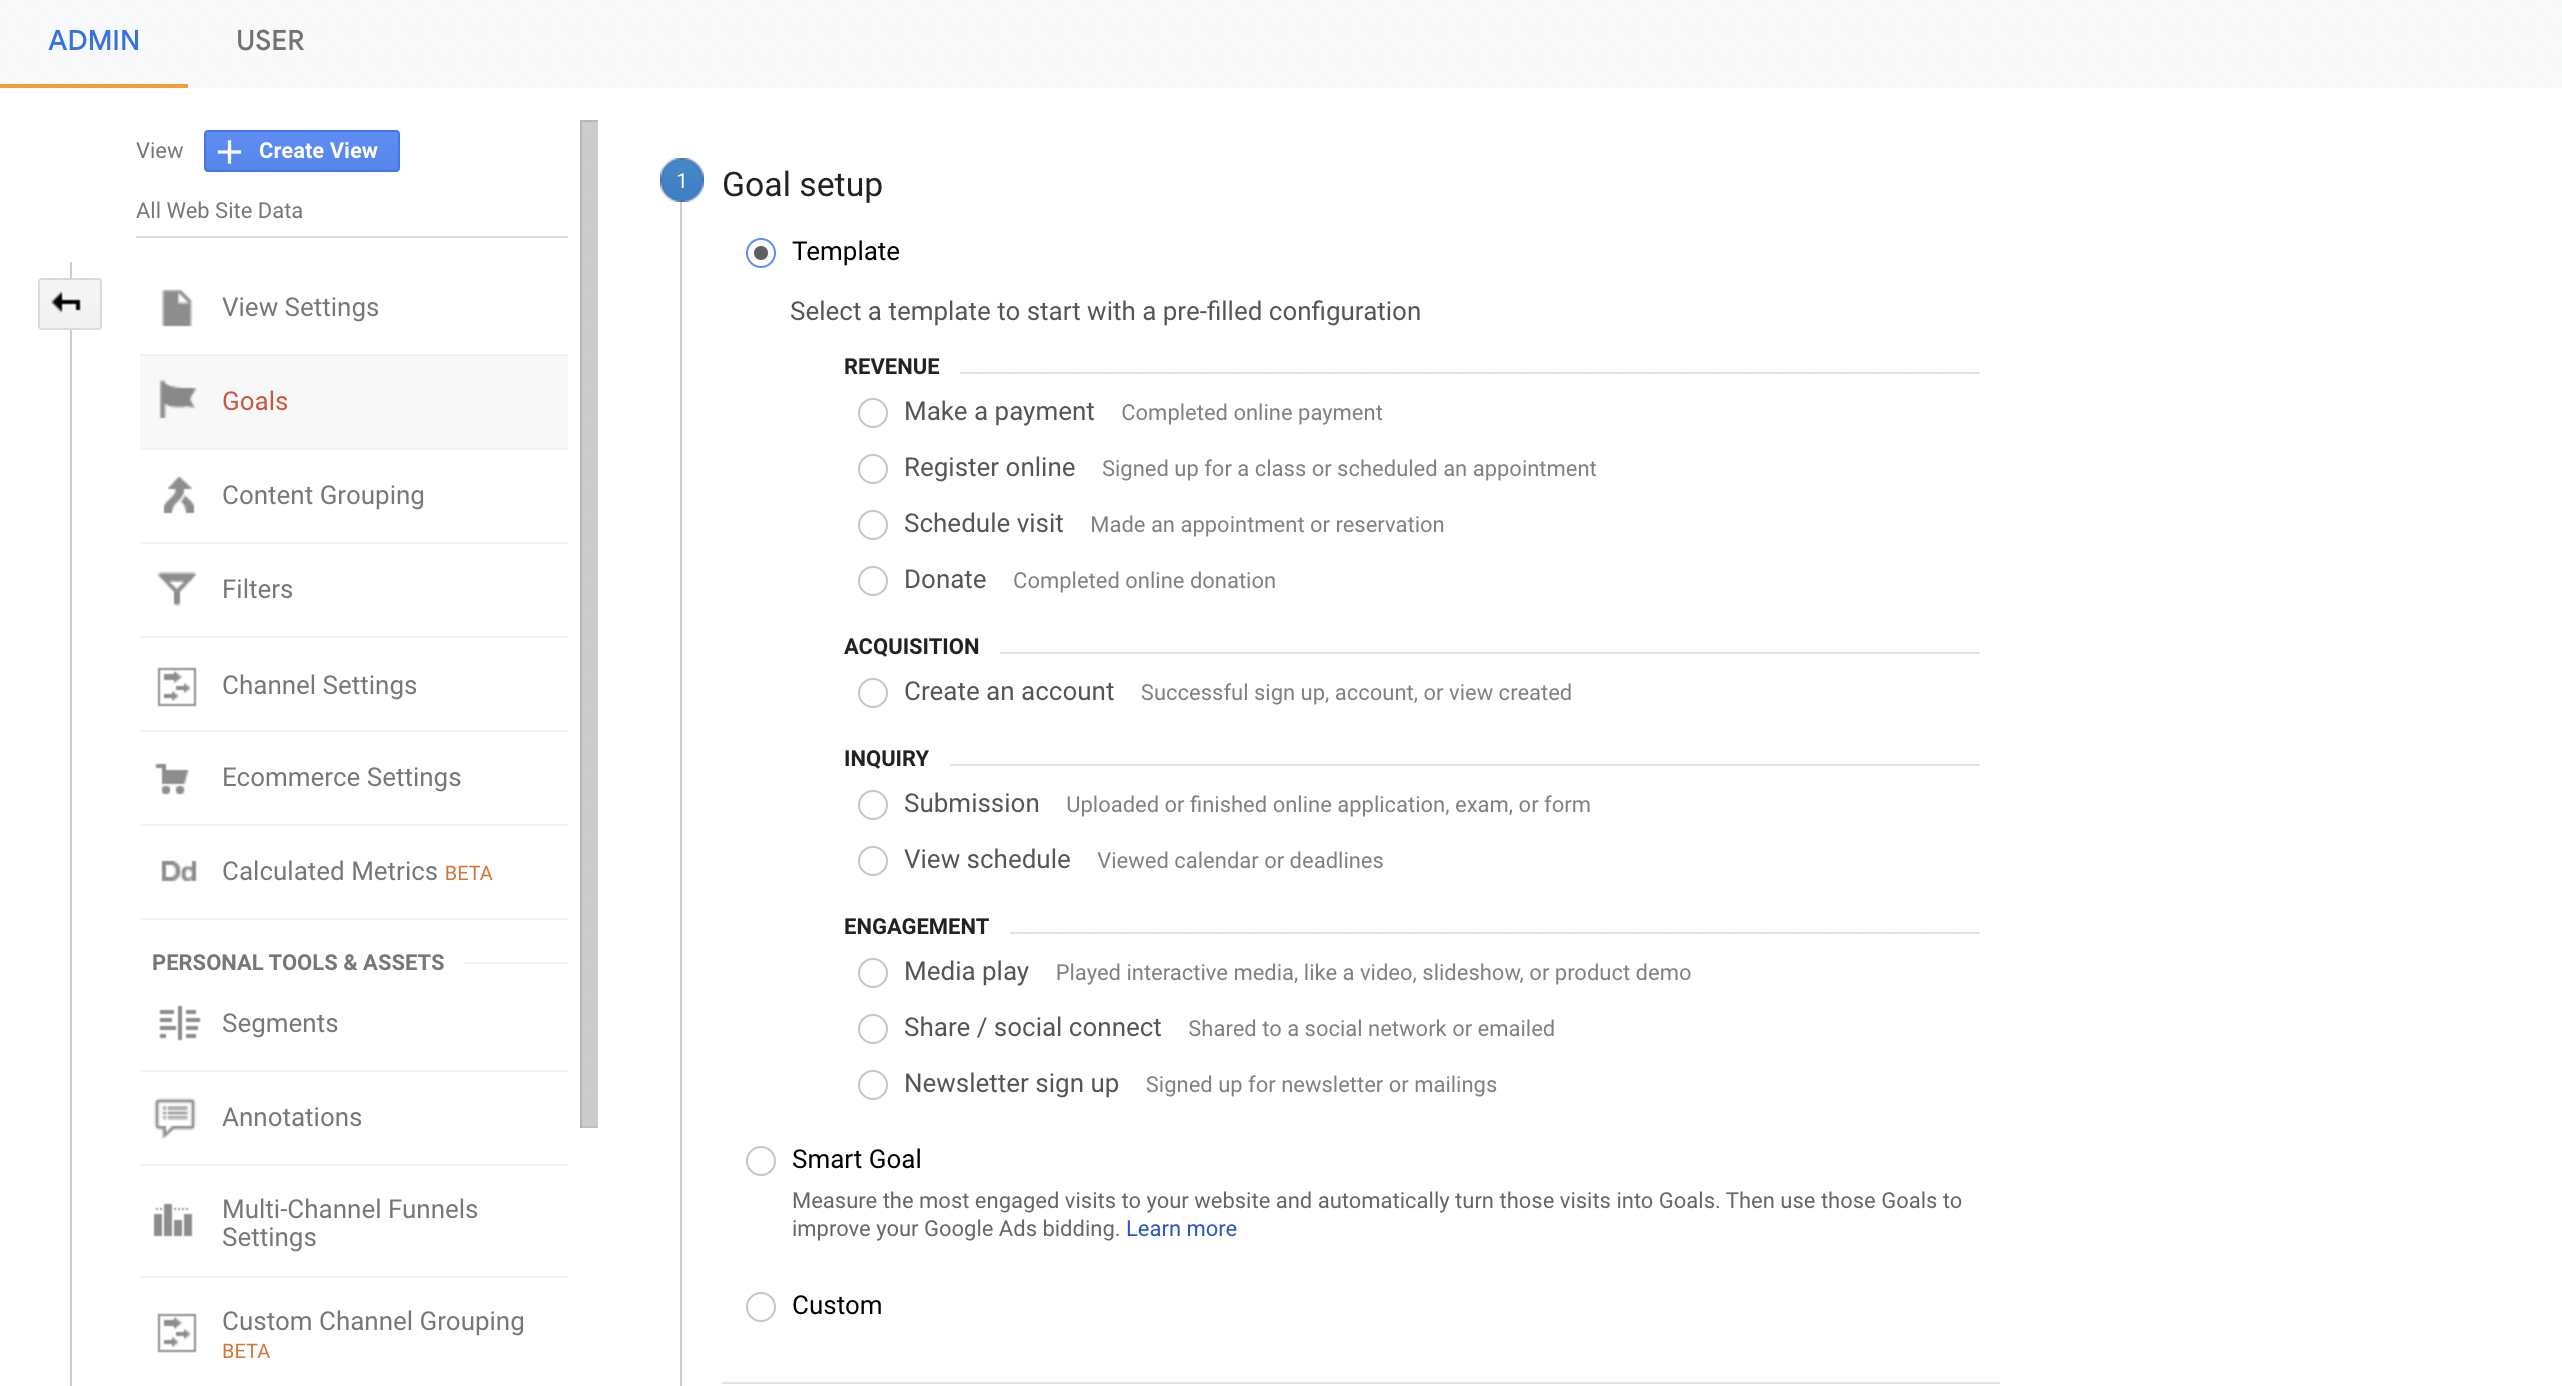
In Google Analytics, the process is a bit more difficult. Points of conversion are not automatically “built in”. Instead, you first have to set up “Goals”; desired actions that you want visitors to take while on your website. Below you can view a list of pre-configured goals and an option to create custom goals.
With “Goals” set up, you can see the pages where the goal occurred, conversion rates, and even view “Reverse Goal Paths”; the pages that a visitor visited before meeting the goal. Once Goals are recorded, however, it does not mean that you can generate a list of names from those Goal conversions.
Why You Need Both Analytics Platforms
Inbound and enrollment marketers often use both Google Analytics and HubSpot to get a full picture of the performance of their website. Google Analytics is best for in-depth data on your website users (location, devices, demographics) at a general audience or group level while HubSpot is best for “closing the loop” and tying website analytics and engagement to specific contacts (the individual level).
If you’re looking to increase leads and conversions on your website, HubSpot is your best bet. If you’re looking for deeper insights on how to improve your website’s performance, Google Analytics is your best bet.
Remember, HubSpot’s analytics tools are geared towards building traffic and leads through content marketing and inbound marketing. Google Analytics, on the other hand, provides granular insights into your website's performance and the users who visit your site. Working in tandem, you'll have access to the data you need and the tactics/channels to support true optimization of your enrollment marketing efforts.
For more on HubSpot’s Traffic Analytics tool, head over to DD Academy to watch our latest tutorial on “Exploring HubSpot’s Traffic and Website Analytics Tools”.

.jpg) EBOOK
EBOOK


.png)